In the Reports tab you will find many useful product sales reports to help you in your daily work, ordering, planning deliveries and product or vending machine location changes.
Product sales report
The product sales report displays the number of all products sold from a selected period, such as today, yesterday, last month, etc. You can use it to create an order of sold out products for the next month.
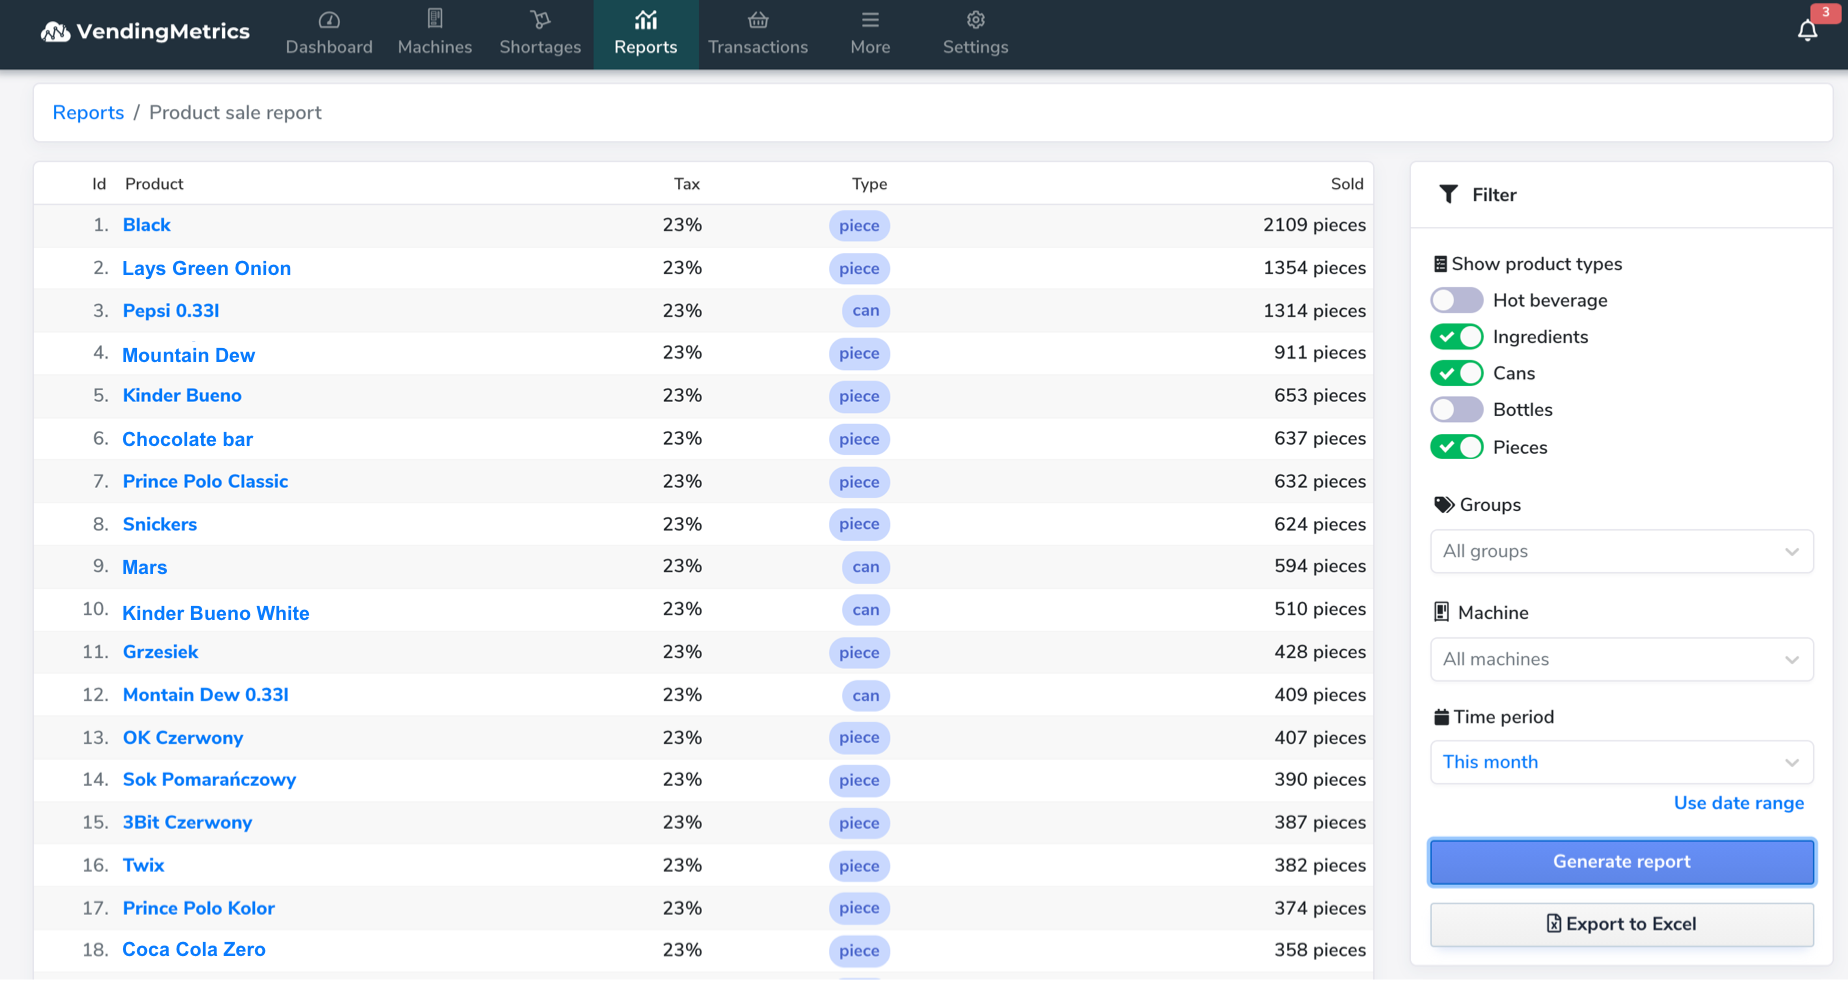
You can filter the report results by
- product type,
- selected vending machines,
- or groups of machines.
To generate the report, select the relevant dates and click the Export to Excel button, then select the same button to Download file with a list of product sales from the selected period.
Sales report
This report shows sales results, number of transactions or revenue, for selected dates, vending machines and products. The graph also allows you to compare sales to the previous year.
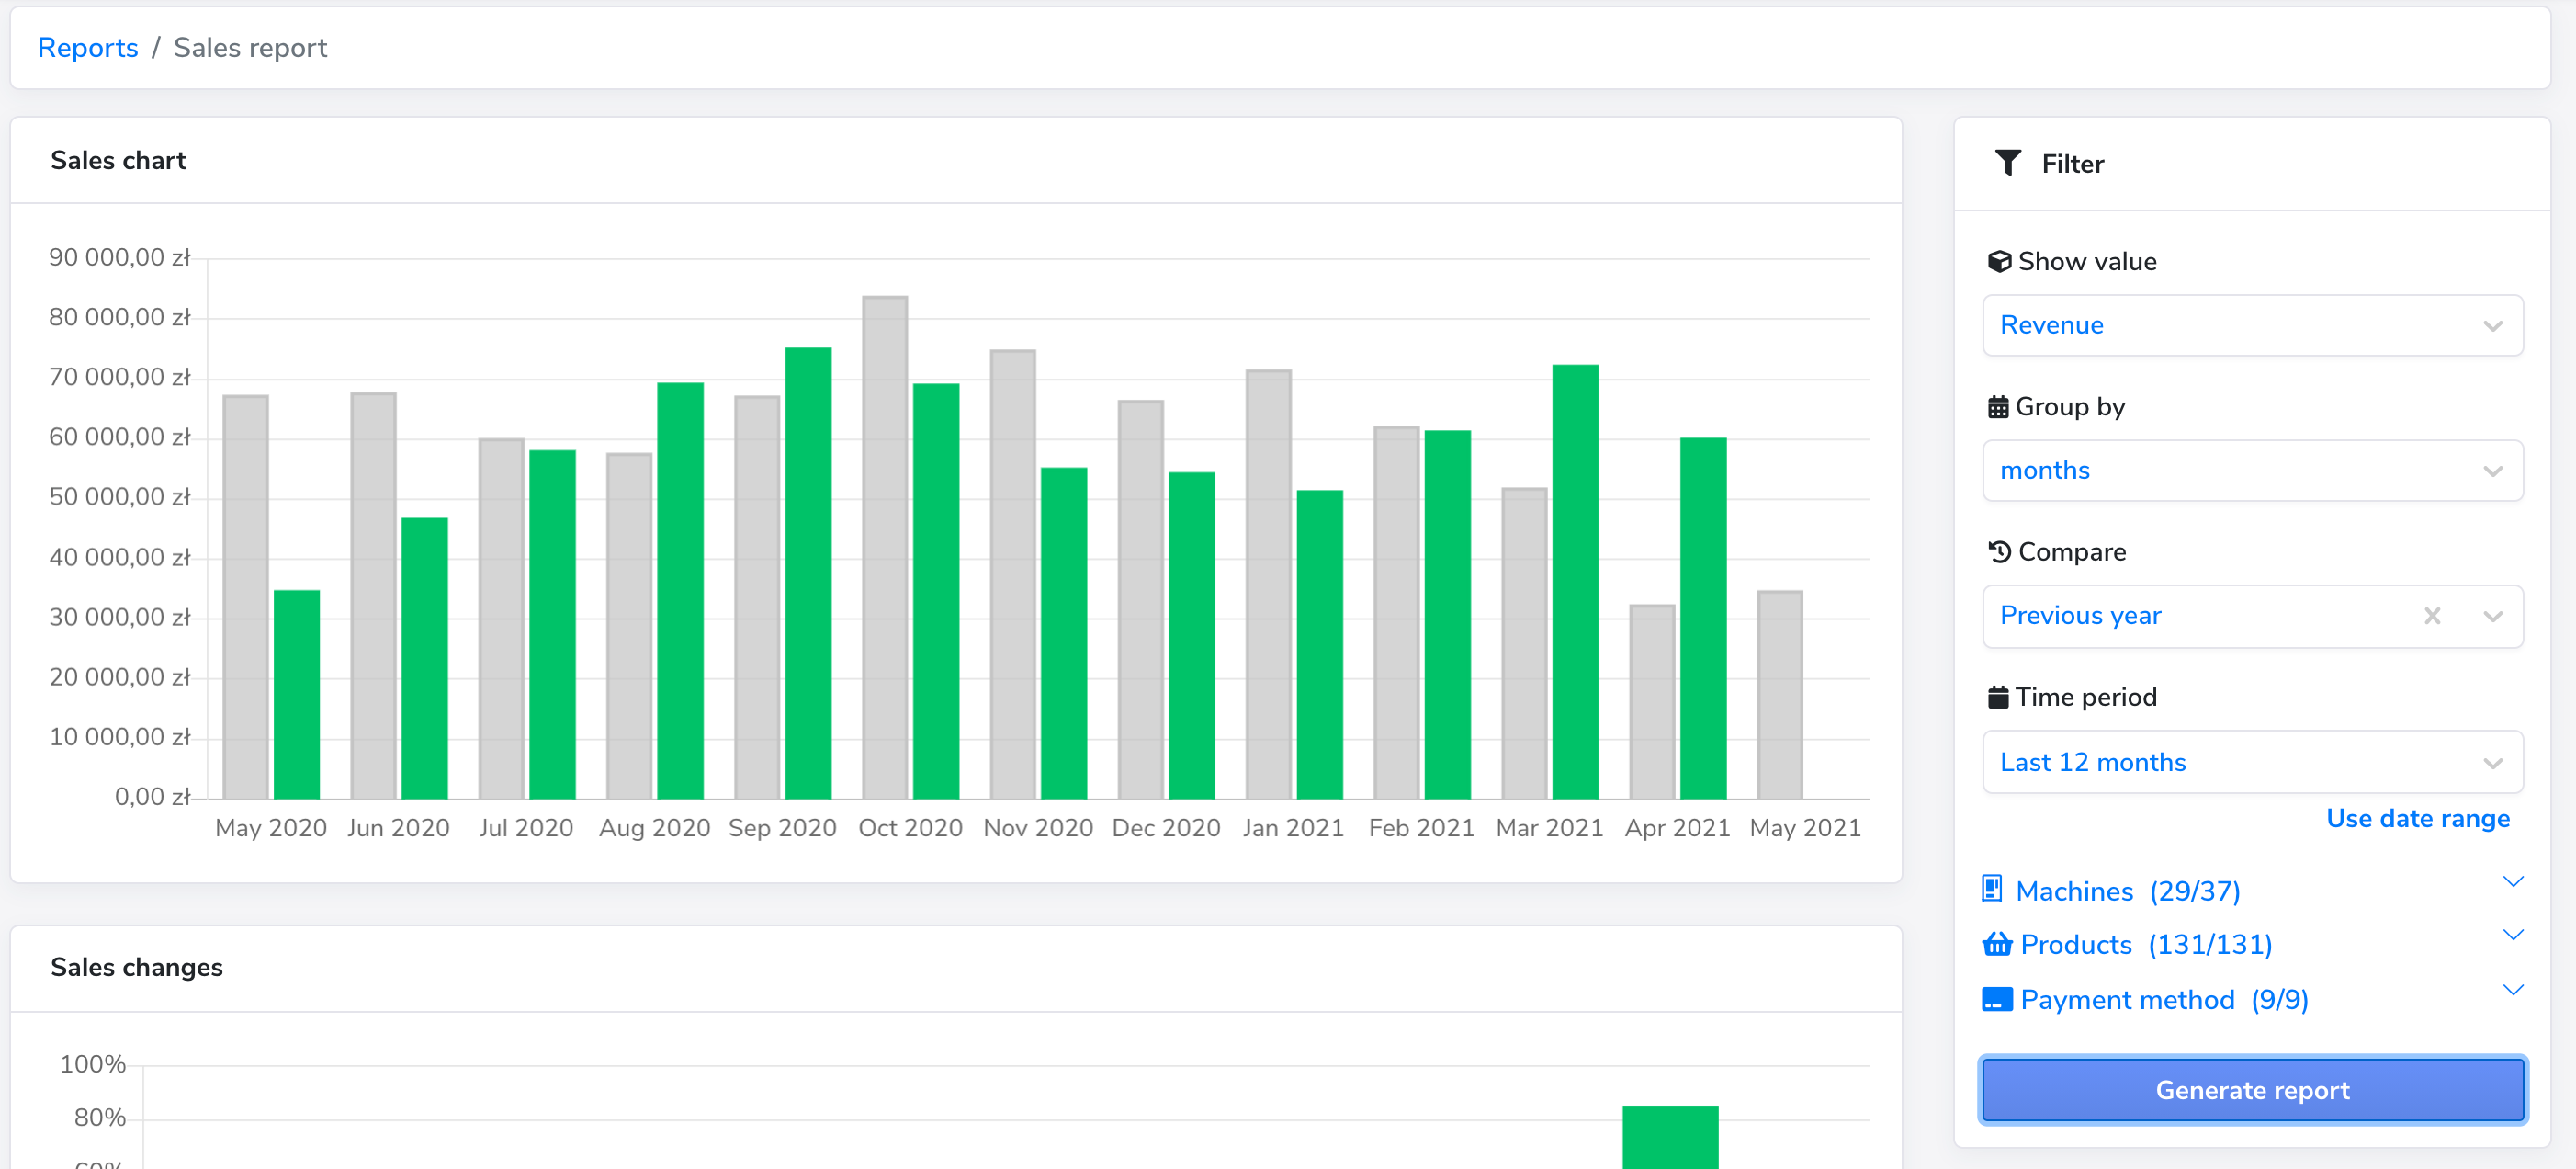
The visual representation of sales allows for a better understanding of trends and helps in making decisions such as changing a product or vending location that is not profitable.
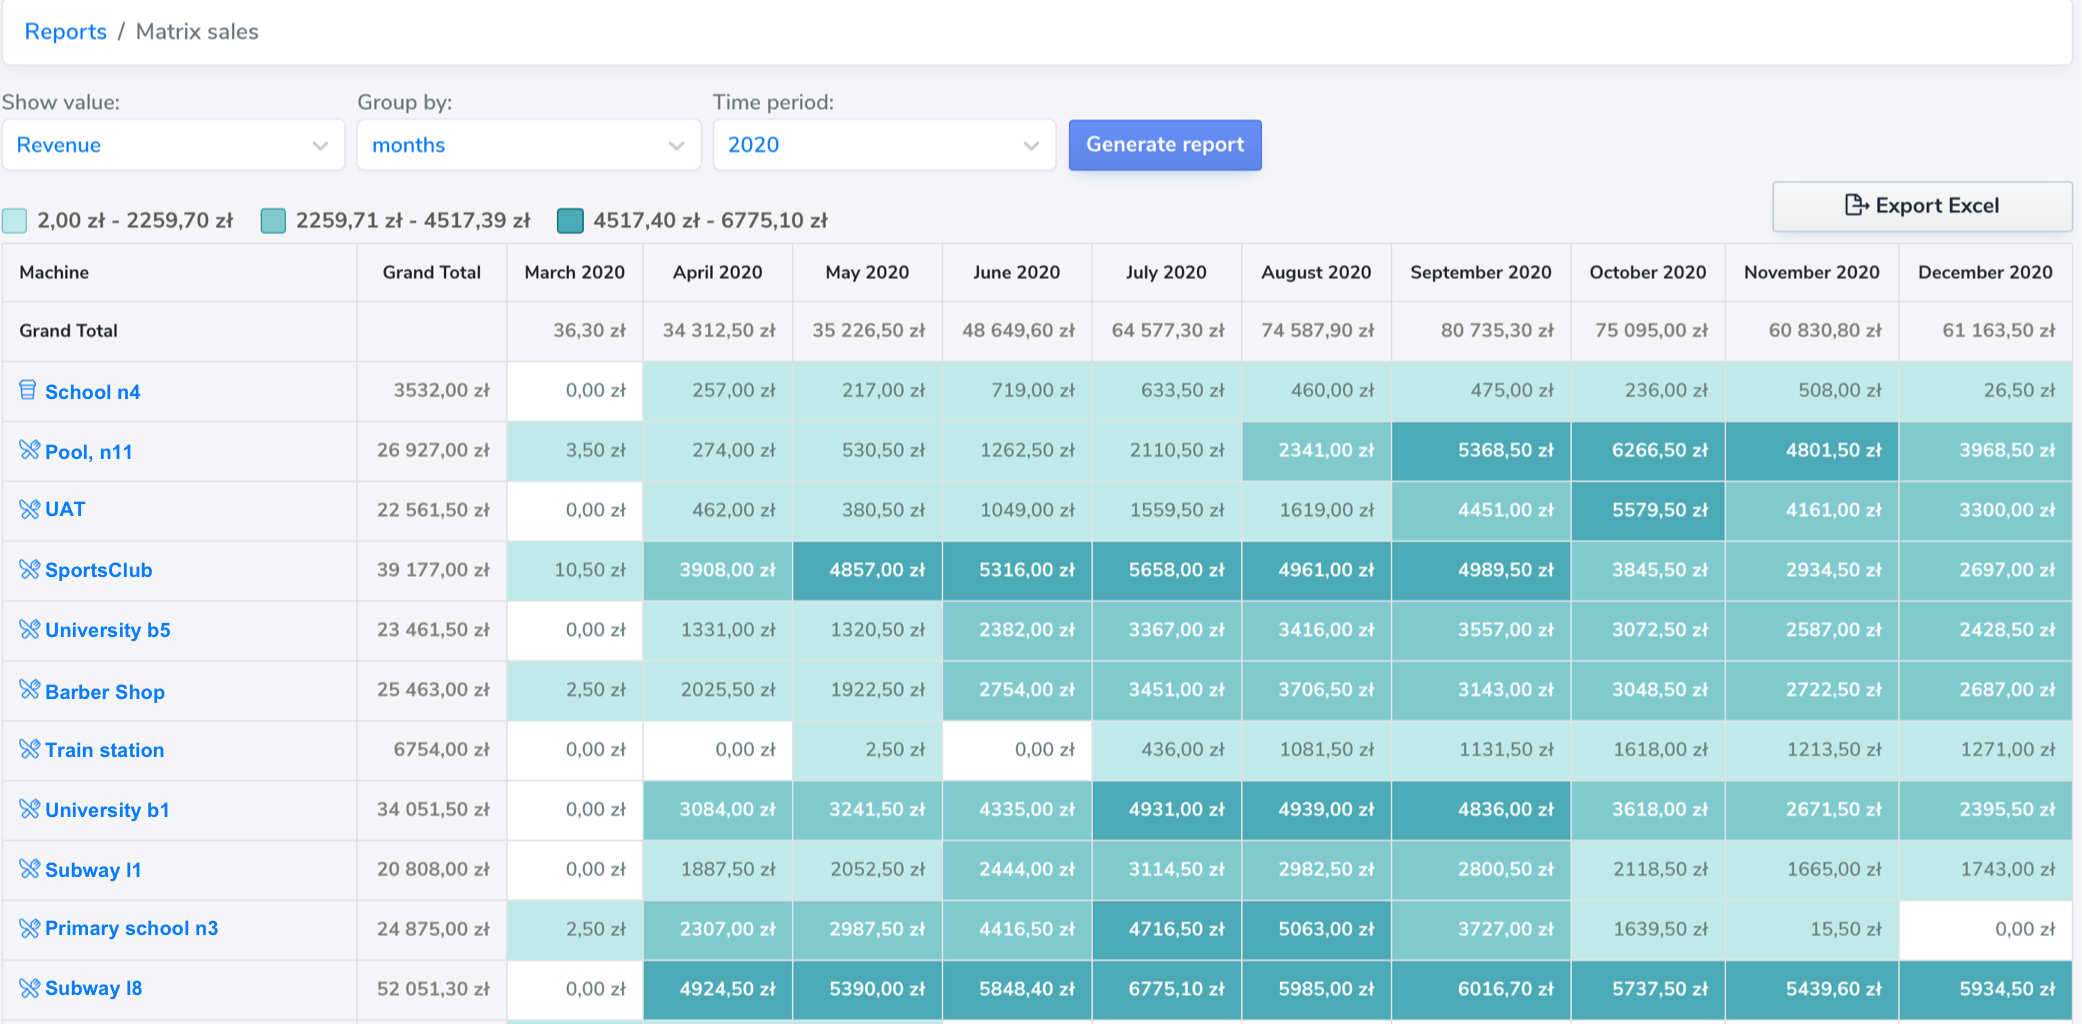
Matrix report
The matrix report presents sales data from vending machines in the form of intensity of the number of products sold or revenue per transaction.
Other reports
- Performance report - shows the performance of the vending machines based on sales information, breakdowns and other relevent data.
- Revenue optimization - a report that will help you increase sales profits with tips and data analysis.
- Product usage - analyses product consumption in your company or branch.
- Uptime report - a report on the performance of vending machines, outages and uptimes.
If you would like to add another report to VendingMetrics, let us know at [email protected]!